Instructions of Tradingview charts
"Show Details" column in the right side
In the chart you may type
1. Symbol
This box will contain the symbol of the asset you are looking at. For example, AAPL if you’re looking at Apple Stock. To search for a specific symbol, simply type it in the box and don’t forget to select the symbol type (stock, forex, index, crypto, …).
2. Timeframes
Selecting the timeframe for your chart is easy, TradingView will give you a large list of options, from 1 second to 1 month, or range options.
3. Chart Type
There are many options to choose from when it comes to chart types. When you click on the icon with the candlesticks, the below menu will give you all the available options.
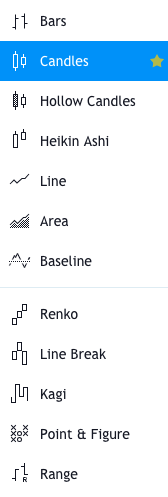
You can now decide to go for bar charts, line charts, candlesticks, Renko, Heikin Ashi, Point & Figure, Kagi, Range charts,…. , that’s the power of TradingView!
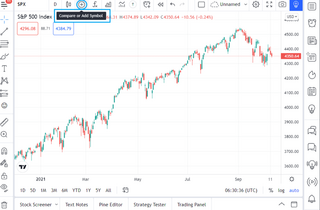
4. Compare
This button allows you to add a second asset on the chart, to enable comparisons. For example, you can add the SPY index if you’re looking at US Stocks, it will allow you to compare your stock’s evolution to the broader index. Other available indexes are Dow 30, Nasdaq 100, Nikkei 225, FTSE 100 or Dax. Alternatively, you can pick any symbol.
5. Indicators
This is obviously one of the most important buttons. There are so many indicators you can choose from in TradingView. To insert an indicator, click on the below logo.
If you click on the arrow you will have a list of the most popular indicators, but if you click on the button you will have a choice of indicators in 6 categories.
Favorites: by ticking the little star next to any indicator, it will appear in your favorites
Built-ins: all the 100+ indicators that come as standard in TradingView
Candlestick Patterns : a great new functionality providing pre-programed well-known patterns (Engulfing, Hammers, Haramis, Dojis, Shooting Stars), very very useful.
Public Library: indicators created by users and made available in the public library, sorted by number of likes which gives an indication of the more popular ones.
My Scripts: indicators you will have created using the Pine Editor.
Volume Profile: you need a Pro account to access this indicator that gives you the most traded prices for a particular time period. It is quite a fantastic tool, and this is how your chart will look like.
Volume Profile
Volume Profile
Financials
TradingView have added this fantastic ability to embed financials below the graph. Just click on the button to get a list of dozens of financial indicators, so that you can monitor the evolution of price alongside the financial aggregate.
6. Templates
Predefined indicator templates, for a specific trading strategy or methodology, such as Bill williams’ 3 lines, ..
7. Alert
Alerts are very useful to warn you that specific price levels have been reached (or crossed). Let me explain how to create a new alert.
Creating an alert in TradingView
To create an Alert, click on the icon, the below box opens up:
Create alert
Create an alert
You first have to decide the condition for the alert to be triggered. For example, AAPL stock to cross the 141$ price level.
Then you decide on the validity of the alert (once or every time), and you can set when it expires.
Finally, you have to decide what the alert will trigger: a popup, a sound, an email or an SMS, you have multiple choices. To validate, click Create.
8. Replay
The Bar Replay function allows you to replay a particular sequence of price evolutions, with an adjustable speed parameter. This can help you test your trading strategies by watching the historical evolution of prices.
To use it, just click on the “Jump to” icon, and adjust the red bar on the chart as your start point. Then launch play and adjust the speed.
9. Undo Redo
As you know them.
10. Layout
This menu will allow you to select the number of charts you wish to have on your layout. Multiple chart layouts however are only available to Pro users.
Multiple layouts are useful when you need different timeframes side by side or if you want to track multiple markets.
At the bottom of the same window, you can also define what elements you would like to sync across all charts.
11. Save
The settings wheel will open a window containing all the main settings:
Style: candle colors, labels on display, you can also activate the sleek Dark Theme
Scales: multiple options are available for left and right scales
Background: color, grid lines, symbol and indicator descriptions and values
Timezone: set your timezone, you can also conveniently choose to show extended hours on intraday charts
Trading: set what elements you would like to see on your graph once you’re in a trade (open positions, orders, …), you can even decide to play a sound when your order is executed
Events & alerts: events such as dividend payments, earnings reports or general economic events can be displayed on your graph. This is really useful to correlate events with their potential impact on price
12. Chart properties
This button opens up a window to fully customize you chart (symbol, status line, scales, appearance, trading) or even add events.
13. Fullscreen
This convenient feature will create a dedicated URL of your chart if you want to share it, alternatively you can decide to save an image on your hard drive, or even tweet the image.
14. Snapshot
Hitting the snapshot button will enable you to either create a link to your chart, download the file or tweet it.
15. Publish
How to compare two charts
The ‘Add’ function shows the new symbol either:
- Overlain directly on the chart of the original symbol or
- Through a new chart panel located below the main chart.
Creating a Tradingview overlay chart
Step 1: Launch TradingView chart
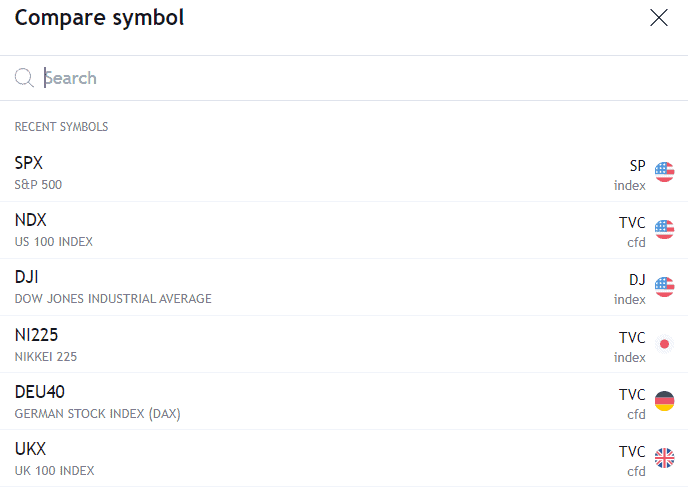
Step 2: Locate the Add (+ icon) on the toolbar > Click this icon
This will open the Compare symbol window. A list of recent symbols will be shown here as well.
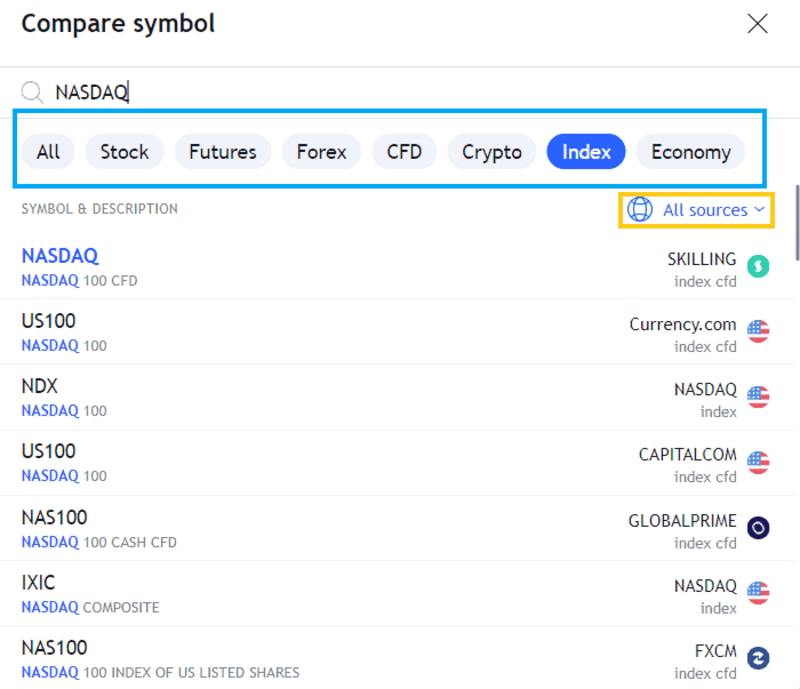
Step 3: In the search bar, type your preferred symbol to Add
TradingView offers asset class filters to help narrow down the list. See blue box below
Alternatively, you can also click on All Sources to select a specific exchange/brokerage filter. See yellow box below.
Step 4: Hover on the symbol > Click one of the options
You will see three options:
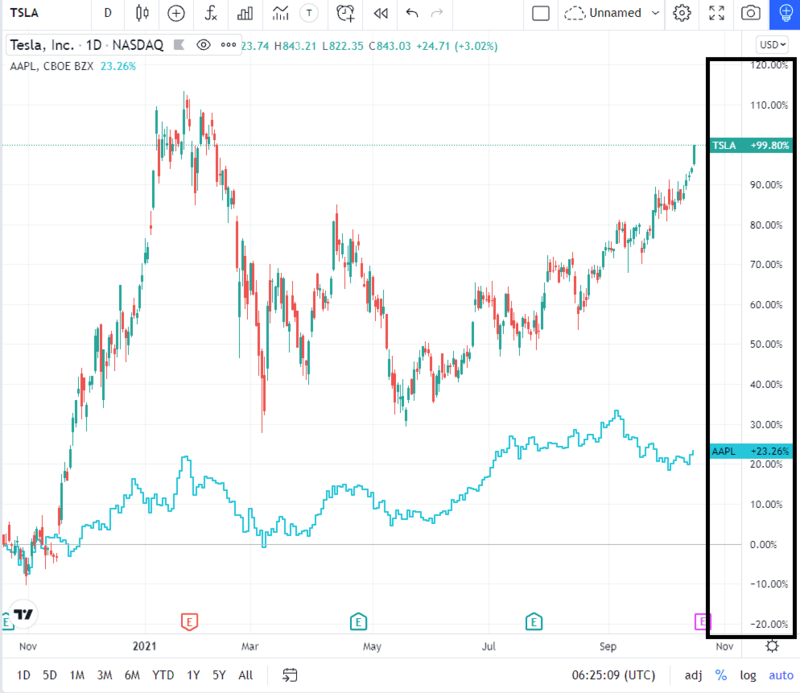
1. Same % scale
• Y or vertical axis will compare the symbols based on a % basis
This overlay type is useful in making an apples-to-apples comparison of the price performance of two or more symbols. In the example above, the two symbols show their current price return (%) computed from the price at the first candle appearing on the chart (from the left).
2. New price scale
• 2 or more vertical/Y axes will appear as primary and secondary
This option is very useful in looking for correlation of price patterns. The axes cannot be compared with each other as it represents the price of each individual symbol.

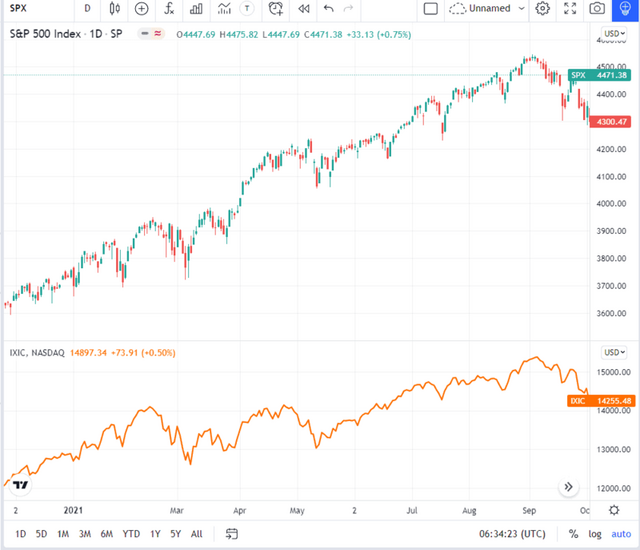
3. New pane
In the new pane option, the new symbol will have its own chart pane and dedicated price scale. This visual offers the following benefits: a) Cleaner and more organized look compared to overlayed symbols; b) Especially important when you are comparing more than 2 symbols; c) Eliminates confusion of having more than one price scales (see blue, black, purple box above). A new pane will grant the symbol with its dedicated price scale (see screenshot below).
Clicking one of the options will automatically add the new symbol on the existing chart.
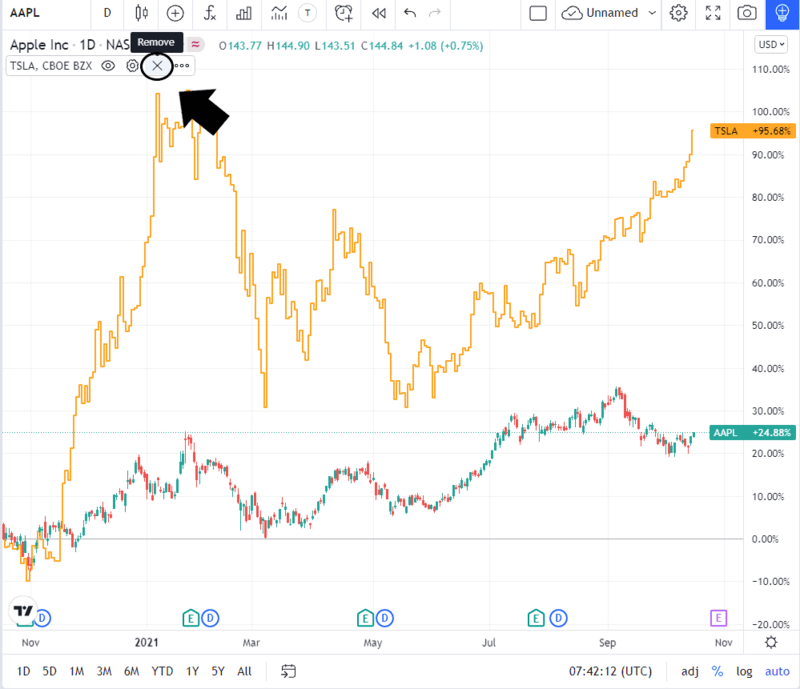
Removing an added symbol
Option 1
Step 1: From the chart, hover on the added symbol from the upper left
Step 2: Click Remove
Option 2
Step 1: Click on the Add (plus icon) symbol from the main toolbar
The Compare Symbol window will appear. You will see the active added symbol under ‘Added Symbols‘
Step 2: Uncheck the check mark on the right to remove
How to customize Tradingview overlay charts
To view customizable elements, follow the steps below:
Step 1: At the top left side of the chart, below the original symbol name, you will see a list. See black box below
These are the data series/indicators/symbols that are currently active on your chart.
Step 2: Hover over the symbol you would like to customize
The following icons will appear:
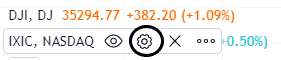
Step 3: Click the gear icon (settings). The Custom preference window will appear
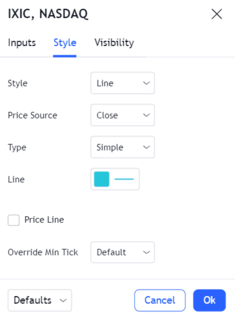
Step 4 [changing data series style]: Click the down arrow in each of the fields to open drop down menu
- Step 4.1: Select from the options provided. See blue box below
- Step 4.2: Some options may have added customizable elements. Adjust accordingly.
- Step 4.2: Click OK
Note: Same method applies for changing other custom elements.